Teaching Titrations in Advanced Chemistry: A Visual and Interactive Approach
Every year, chemistry students struggle with titrations—a topic packed with calculations, stoichiometry, and understanding molecular-level changes in acid-base reactions. Helping students grasp key aspects, like identifying equivalence points and understanding the major species present at different stages, can be a challenge for teachers.
Using a manipulative tool to introduce titrations visually, before diving into calculations, can make this topic far more approachable. By exploring the molecular interactions first, students build a strong conceptual foundation, making the math less intimidating. In this article, we’ll guide you on using this interactive tool, explain its effectiveness, and offer tips to ensure students grasp the concepts before tackling calculations.

Why Titrations Are Challenging for Students
Understanding Acid-Base Titrations and Why They Challenge Students
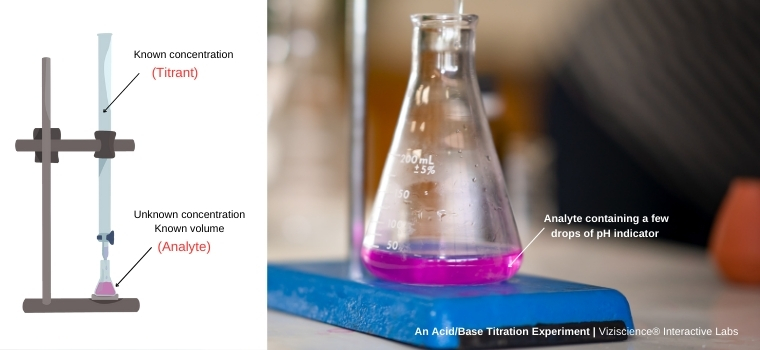
Acid-base titration is a technique used to determine the unknown concentration of an acid or base by neutralizing it with a known volume and concentration of another substance (the titrant). This process involves carefully adding a titrant to a solution until the equivalence point is reached, where the amount of acid equals the amount of base, and the reaction is neutralized.
However, titrations can be conceptually challenging for students because they require mastering several key concepts:
- Acid-Base Dissociation: How acids and bases dissociate into ions in solution (e.g., H⁺ and OH⁻ ions).
- Neutralization: The reaction between H⁺ ions from acids and OH⁻ ions from bases to form water (H₂O).
- Equivalence Point: The point during titration where the amount of acid equals the amount of base, leading to complete neutralization.
- Stoichiometry: The quantitative relationship between reactants and products in a chemical reaction, crucial for calculating the titrant required.
- Molarity: Understanding concentration (moles per liter) to relate the amounts of titrant and analyte.
- Titration Curve: The graphical representation of pH changes during titration, helping students track progress and identify the equivalence point.
- Indicator: A substance used to visually signal when the equivalence point is reached, typically by a color change.
- Major Species Present: Identifying the predominant ions in solution at different stages of titration.
- Spectator Ions: Ions that do not participate in the chemical reaction but are present in the solution (e.g., Na⁺ or Cl⁻ in the case of NaOH and HCl).
Students often lose sight of the underlying chemical processes when they progress to calculations too soon. Without a solid grasp of molecular changes during a titration process, the math can feel overwhelming. Introducing a visual, hands-on approach early on helps students connect the calculations to molecular-level changes, making the topic more approachable and clear.
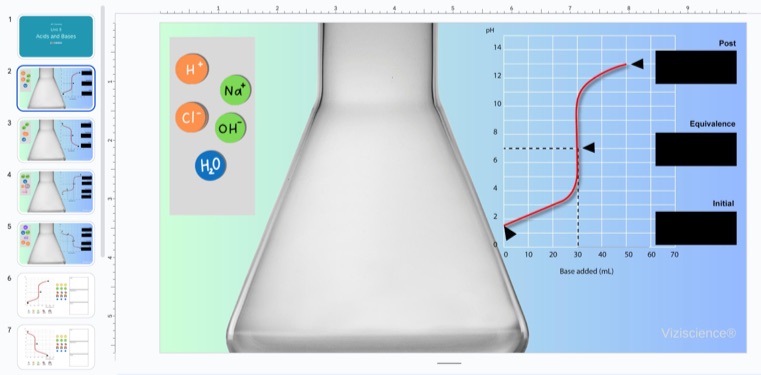
Slide: Strong Acid-Strong Base Titration (HCl and NaOH)

This slide helps students visualize the dissociation of acids and bases, track the titration process, and identify the key species present at different stages. Here’s how to guide them:
Start by adding a few moles of HCl into the flask (suggested: 6 moles). Students will observe HCl dissociating into H⁺ and Cl⁻ ions. As they add NaOH, they can visualize Na⁺ and OH⁻ ions dissociating, with H⁺ ions combining with OH⁻ ions to form water, reinforcing their understanding of neutralization.
Encourage students to observe the molecular changes and identify the equivalence point when all the acid has been neutralized. As they continue adding NaOH, they can explore what happens when base is added beyond the equivalence point, helping them understand the changing species in the solution.
Titration Graph
Alongside the titration, students should track the titration graph, observing how pH changes as NaOH is added to HCl. Initially, the graph shows a low pH due to the strong acid. As NaOH neutralizes the H⁺ ions, pH rises. At the equivalence point, the pH shifts significantly, typically reaching 7 for a strong acid-strong base titration. Beyond this point, excess OH⁻ raises the pH sharply.
By comparing the graph and molecular changes, students can deepen their understanding of pH, neutralization, and reaction completeness.
Slide: Strong Base-Strong Acid Titration (NaOH and HCl)
Once students understand the strong acid-strong base titration, reverse the scenario. Have them place NaOH in the flask and titrate it with HCl. This reinforces the concept from another perspective, helping students practice identifying the equivalence point and deepening their understanding of neutralization.
Introducing Particle Diagrams for Titrations
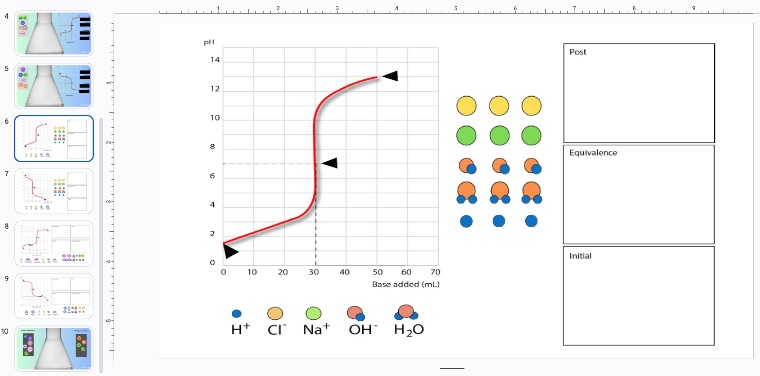
Once students have a solid understanding of the titration process and can confidently interpret titration graphs, it’s beneficial to introduce particle diagrams. These diagrams allow students to visualize what’s happening at the molecular level during each stage of the titration.

Teachers can create worksheets that guide students through drawing particle diagrams at different points in the titration—before titration begins, at the equivalence point, and beyond. These diagrams help students depict the dissociation of acids and bases, the formation of water, and the presence of spectator ions, reinforcing their conceptual understanding.
By working on particle diagrams, students can:
- Illustrate the molecular changes as titration progresses.
- Visualize the ratio of reactants to products at each stage.
- Identify major species before, during, and after neutralization.
Encouraging students to complete these worksheets not only strengthens their grasp of titrations but also helps them connect the visual, molecular, and mathematical aspects of the experiment, ensuring a comprehensive understanding of the topic.
Benefits of Using the Manipulative as a Pre-Lesson Activity
Using this tool as a pre-classroom activity sets a solid foundation for the titration unit. Here’s why it’s effective:
- Visual Learning: Abstract concepts become tangible when students can see dissociation and neutralization at the molecular level.
- Active Engagement: Dragging ions and manipulating the simulation keeps students engaged while reinforcing key concepts.
- Building Confidence: By focusing on concepts first, students build confidence and are better prepared for the math.
- Stronger Conceptual Foundation: Connecting the visual changes to the math helps students understand not only how to calculate but also why they’re doing it.
Taking the Next Steps

Teaching Buffer Solutions: Addressing Student Challenges with Interactive Simulations
Understanding buffer solutions can be one of the most challenging topics for students in advanced chemistry. The concept involves complex ideas such as equilibrium, weak acid-base conjugate pairs, and the delicate balance between components that maintain pH stability. Often, students struggle to grasp how buffers function on a molecular level, and traditional methods of teaching through equations and theory can make the concept even more difficult to understand.
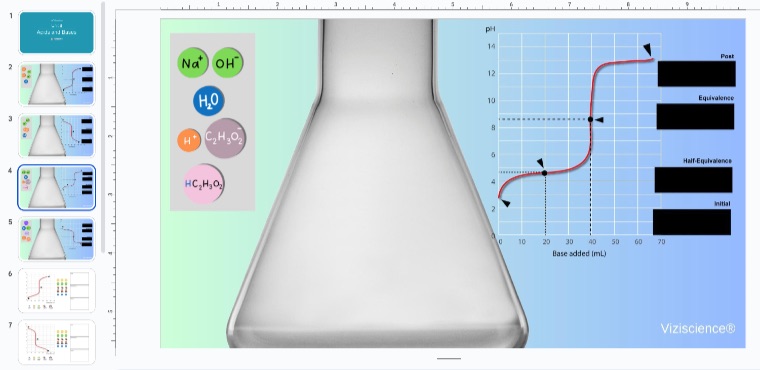
To offer a more hands-on and conceptual approach, the final simulation includes a buffer system with components such as acetic acid, acetate, ammonia, ammonium, sodium hydroxide, and HCl.
Students can experiment, test their hypotheses, and observe the immediate effects of their choices, helping to solidify their understanding of this complex topic. An effective buffer is typically created when the solution contains roughly equal amounts (50%) of a weak acid and its conjugate base, or a weak base and its conjugate acid. This balance allows the buffer to resist pH changes most effectively, a concept teachers can easily demonstrate using this simulation.
How Teachers Can Use This Tool
The interactive nature of the slide allows teachers to guide students through the process of creating buffer solutions. Teachers can:
- Simulate buffer creation: Demonstrate how mixing acetic acid with acetate or ammonia with ammonium forms a buffer system.
- Show pH changes: Use the provided components (NaOH, HCl) to show students how buffers resist changes in pH.
- Explore buffer capacity: Visualize how different ratios of acid and base components affect the buffer’s ability to neutralize small amounts of added acid or base.
Creating Worksheets for Active Learning
Teachers can enhance learning by creating custom worksheets that prompt students to use the components provided in the simulation. These worksheets might ask students to:
- Identify the conjugate acid-base pairs in different buffer systems.
- Predict the pH of a buffer solution given certain concentrations of acetic acid and acetate or ammonia and ammonium.
- Experiment with different concentrations of components and observe how buffer capacity changes in the simulation.
- Analyze how the addition of small amounts of HCl or NaOH affects the buffer and its ability to maintain pH stability.
By working through these problems with the simulation, students can develop a deeper, intuitive understanding of how buffers work on a molecular level.


Your ability to distill complex concepts into digestible nuggets of wisdom is truly remarkable. I always come away from your blog feeling enlightened and inspired. Keep up the phenomenal work!
Thank you for the kind comment. I really appreciate it!
Wonderful beat I wish to apprentice while you amend your web site how could i subscribe for a blog web site The account aided me a acceptable deal I had been a little bit acquainted of this your broadcast provided bright clear idea