
Measuring rate
This section aims to cover the following topics:
- Define chemical reaction rate
- Define rate expression
- Relative rates of reaction and stoichiometry ratio
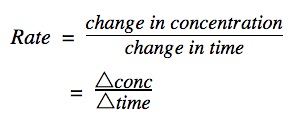
Change in concentration over time
The rate of a chemical reaction can be thought of as the speed at which a chemical reaction happens and this can be expressed as the change in concentration of a substance over time:
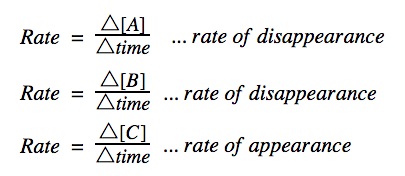
Rate of reactant / product
For a reaction A + B → C, where A and B are the reactants and C is the product, you can measure how fast a reactant is disappearing (A or B), or how fast a product is appearing (C).
Rate of reaction graphs
The concentration vs time graph shows the amount of reactant being used up over time or the amount of product being produced over time. The graphs will have slopes going in opposite directions to each other as illustrated below.
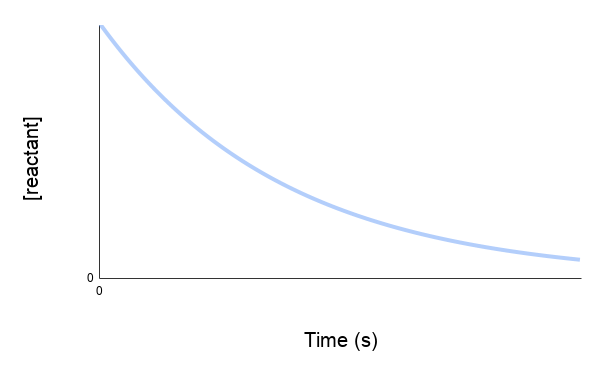 The reactant is depleting over time, the graph has a descending curve
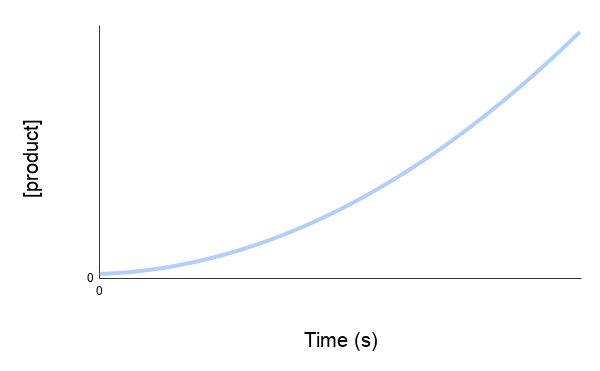 The product is increasing over time, the graph has an ascending curve
Initial, instantaneous, & average rate
It’s important to know the difference between instantaneous and average rate of reaction. Click on the tabs below to learn more.
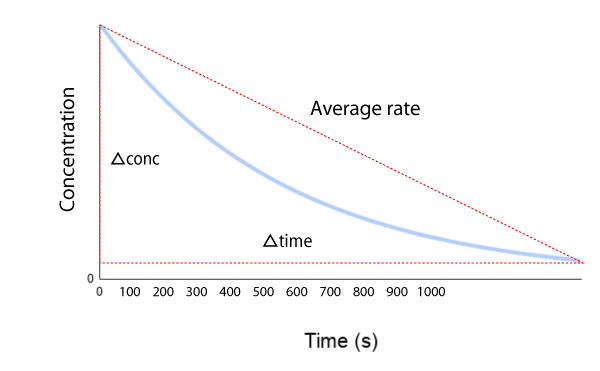 The average rate of reaction is the change in concentration over the period of time. It can be determined by the slope of the line.
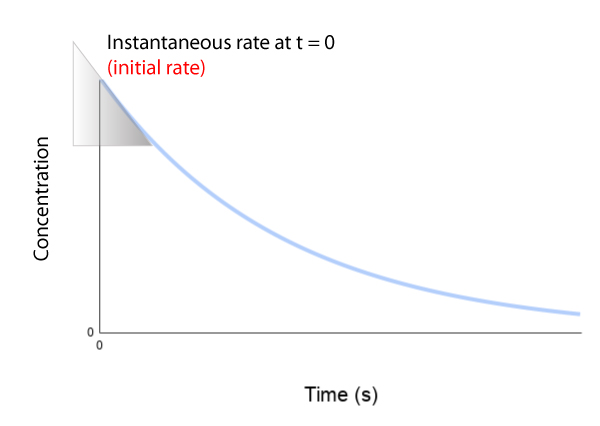 The initial rate of a reaction is the instantaneous rate at the start of the reaction. The initial rate can be calculated using the negative slope of the curve (at t=0) of the reactant concentration vs time curve.
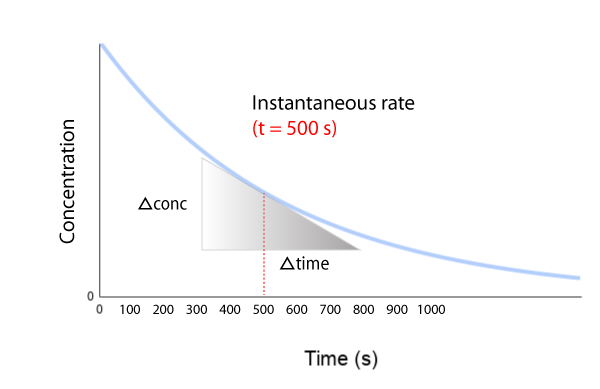 The instantaneous rate is the rate at some instant in time (eg. at t=500 s). To calculate the instantaneous rate, measure the negative slope of the line tangent to the curve at the time t of the reactant vs time curve. You can also use the product vs time curve to calculate instantaneous rate of reaction.
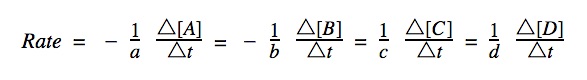
Stoichiometric ratio
Given a reaction equation: aA + bB → cC + dD where A and B are the reactants and C and D are the products, and a,b,c and d are the coefficients, the rate of reaction between the substances are relative to each other and the relationship is linked via the stoichiometric ratio:
Change in concentration is calculated using [A]final – [A]initial and change in time is calculated using T(final) – T(initial).
Decrease in Concentration: In a chemical reaction, as reactants are consumed, their concentrations decrease over time. This means that if you take the final concentration of a reactant (at a later time) and subtract the initial concentration (at an earlier time), the result will be a negative value. This is because the final concentration of a reactant is less than its initial concentration.
Speed cannot be negative so the reactant rates are given (-) sign in front in order to cancel out the negative values.
Example:
if the concentration of a reactant decreases by 0.2 M over a certain time period, we would say the rate of the reactant being used up is 0.2 M/s. We would not use “-0.2 M/s” because rates of reaction are expressed as positive values.
Symbolic vs. Practical Representation: The negative sign in the formulaic expression is symbolic, acknowledging that reactants are consumed.
Gas syringe experiment
Video credit: Dr. Read
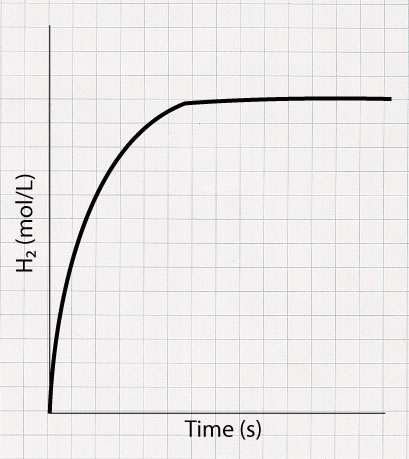
Magnesium and HCl experiment
To learn about reaction rate, a simple experiment using magnesium and hydrochloric acid can be performed.
Mg(s) + 2HCl(aq) → MgCl₂(aq) + H₂(g)
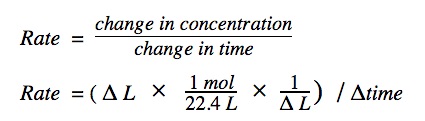
In this experiment a small piece of magnesium ribbon is placed in HCl solution and the reaction produces hydrogen gas. The gas is collected in a gas syringe and the volume produced is measured every 10 seconds. Using the data collected, a graph can be generated using an excel spreadsheet. From the graph, the initial, average, and instantaneous rate of reaction can be determined using the methods described above.
The change in volume must first be converted to change in concentration in order to plot the concentration vs time graph.
A graph of [H₂] vs time can be plotted. It will look like something below. The graph starts off very steep to denote the quick production of H₂. As time proceeds, the reaction slows down and eventually stops when all of the Mg is completely used up.